Issue 31: When the Closest Pharmacy is Too Far: Mapping Pharmacy Deserts in Massachusetts
The impact of closures on pharmacy distribution and access over time
 HPC DataPoints is a series of online briefs that spotlight new research and data findings relevant to the HPC’s mission to improve the affordability of health care. As you read through HPC DataPoints, we encourage you to engage with the interactive graphics by hovering your mouse over different data points to obtain additional information. A printable version of each brief is also available.
Background
Pharmacies are a vital part of the health care continuum for patients, as an access point for over-the-counter medications, a setting to receive preventive services – such as vaccinations – and a place for pharmacists to dispense prescription medications and offer consultations to ensure their safe and effective use. Pharmacy closures reduce access to these services and have been found to be associated with negative health effects, such as clinically significant declines in adherence to cardiovascular medications among older adults.[1] Pharmacy deserts refer to communities without convenient access (defined below) to a pharmacy and the medication and services they provide.
Pharmacy closures, and the deserts they may create, occur amid complex and evolving dynamics in the pharmaceutical supply chain and in the wider retail economy. Large retail pharmacy chains such as CVS and Walgreens expanded significantly nationwide from the 1990s to the 2010s, culminating in CVS’ acquisition of 1,700 Target pharmacies in 2015 and Walgreens’ acquisition of 1,900 Rite Aid pharmacies in 2018.[2],[3] Grocery (e.g., Big Y, Stop & Shop) and mass-merchant-based (e.g., Walmart) pharmacies may have survived consolidation partly due to their economies of scale and their convenient locations.[3]
In contrast, many independent pharmacies went out of business during this wave of expansion and consolidation.[4]
A 2019 study by the Massachusetts Independent Pharmacists Association found that the number of independent pharmacy claims where total reimbursement was less than the acquisition cost of the drugs grew from 8% of total claims in 2016 to 26% of claims in 2019; accounting for the pharmacy’s administrative cost to provide services, the study estimated that 86% of claims resulted in a financial loss to the pharmacy.[5] As a result of these pressures nationwide, the number of independent pharmacies in the U.S. plummeted by 50% between the 1980s to 2021.[3]
Despite their earlier market dominance, large retail chain pharmacies recently began announcing store closures as well, citing both financial pressures from PBMs and lower front-end store profitability due to the growth of dollar stores and online retailers such as Amazon.[6],[7] Collectively, Rite Aid (which filed for Chapter 11 bankruptcy in 2023), CVS, and Walgreens have announced plans to close more than 1,500 locations.[8]
Consequently, communities across the country, particularly rural and lower-income communities, are increasingly left with insufficient pharmacy access. A study that examined pharmacy deserts nationwide found that 46% of U.S. counties have at least one pharmacy desert, and such deserts were significantly more common in high social vulnerability areas.[9]
Massachusetts neighborhoods are experiencing the impact of pharmacy closures.[10] A recent Boston Globe analysis of Massachusetts Department of Public Health (DPH) data found that 200 pharmacies have closed in the Commonwealth since 2017.[11] The Globe further estimated that at least 15,000 people in Boston live in pharmacy deserts, including neighborhoods in East Boston, Dorchester, and Roxbury.
This issue of the HPC’s DataPoints series assesses the number, type, and geographic distribution of pharmacies in Massachusetts over time, and identifies both pharmacy deserts and “near-deserts” — communities that are vulnerable to becoming pharmacy deserts — across the state.
Pharmacy Locations and Distribution
The HPC identified pharmacy name, location, license status, issue and expiration dates for all active pharmacies using retail drug store permit data from the Board of Registration in Pharmacy.[12] Compounding, specialty, and provider-based pharmacies that are not open to the general public were excluded from this analysis.
The HPC considered five types of pharmacies for this analysis:
- Large chain (e.g., CVS, Walgreens)
- Grocery-based (e.g., Stop & Shop, Big Y)
- Small chain and independent (e.g., Eaton Apothecary, Louis and Clark)
- Mass-merchant (e.g., Walmart, Costco)
- Provider-based and open to the general public (i.e., co-located and operated by hospitals and other providers)
As of June 2025, there were 940 active pharmacies in Massachusetts. Interactive 1 shows the location and type of pharmacy. Large chain pharmacies represented the largest proportion of pharmacies in 2025 at 61%, followed by small chain/independent and grocery-based pharmacies at 13% each (see Figure 1 in the following section).[i] See the interactive visualization at the end of the section for recent trends in pharmacy location and type.
Interactive 1: Active Pharmacies by Type, 2016-2025
Pharmacy Closures
Figure 1: Number of Pharmacies by Type, 2016-2025
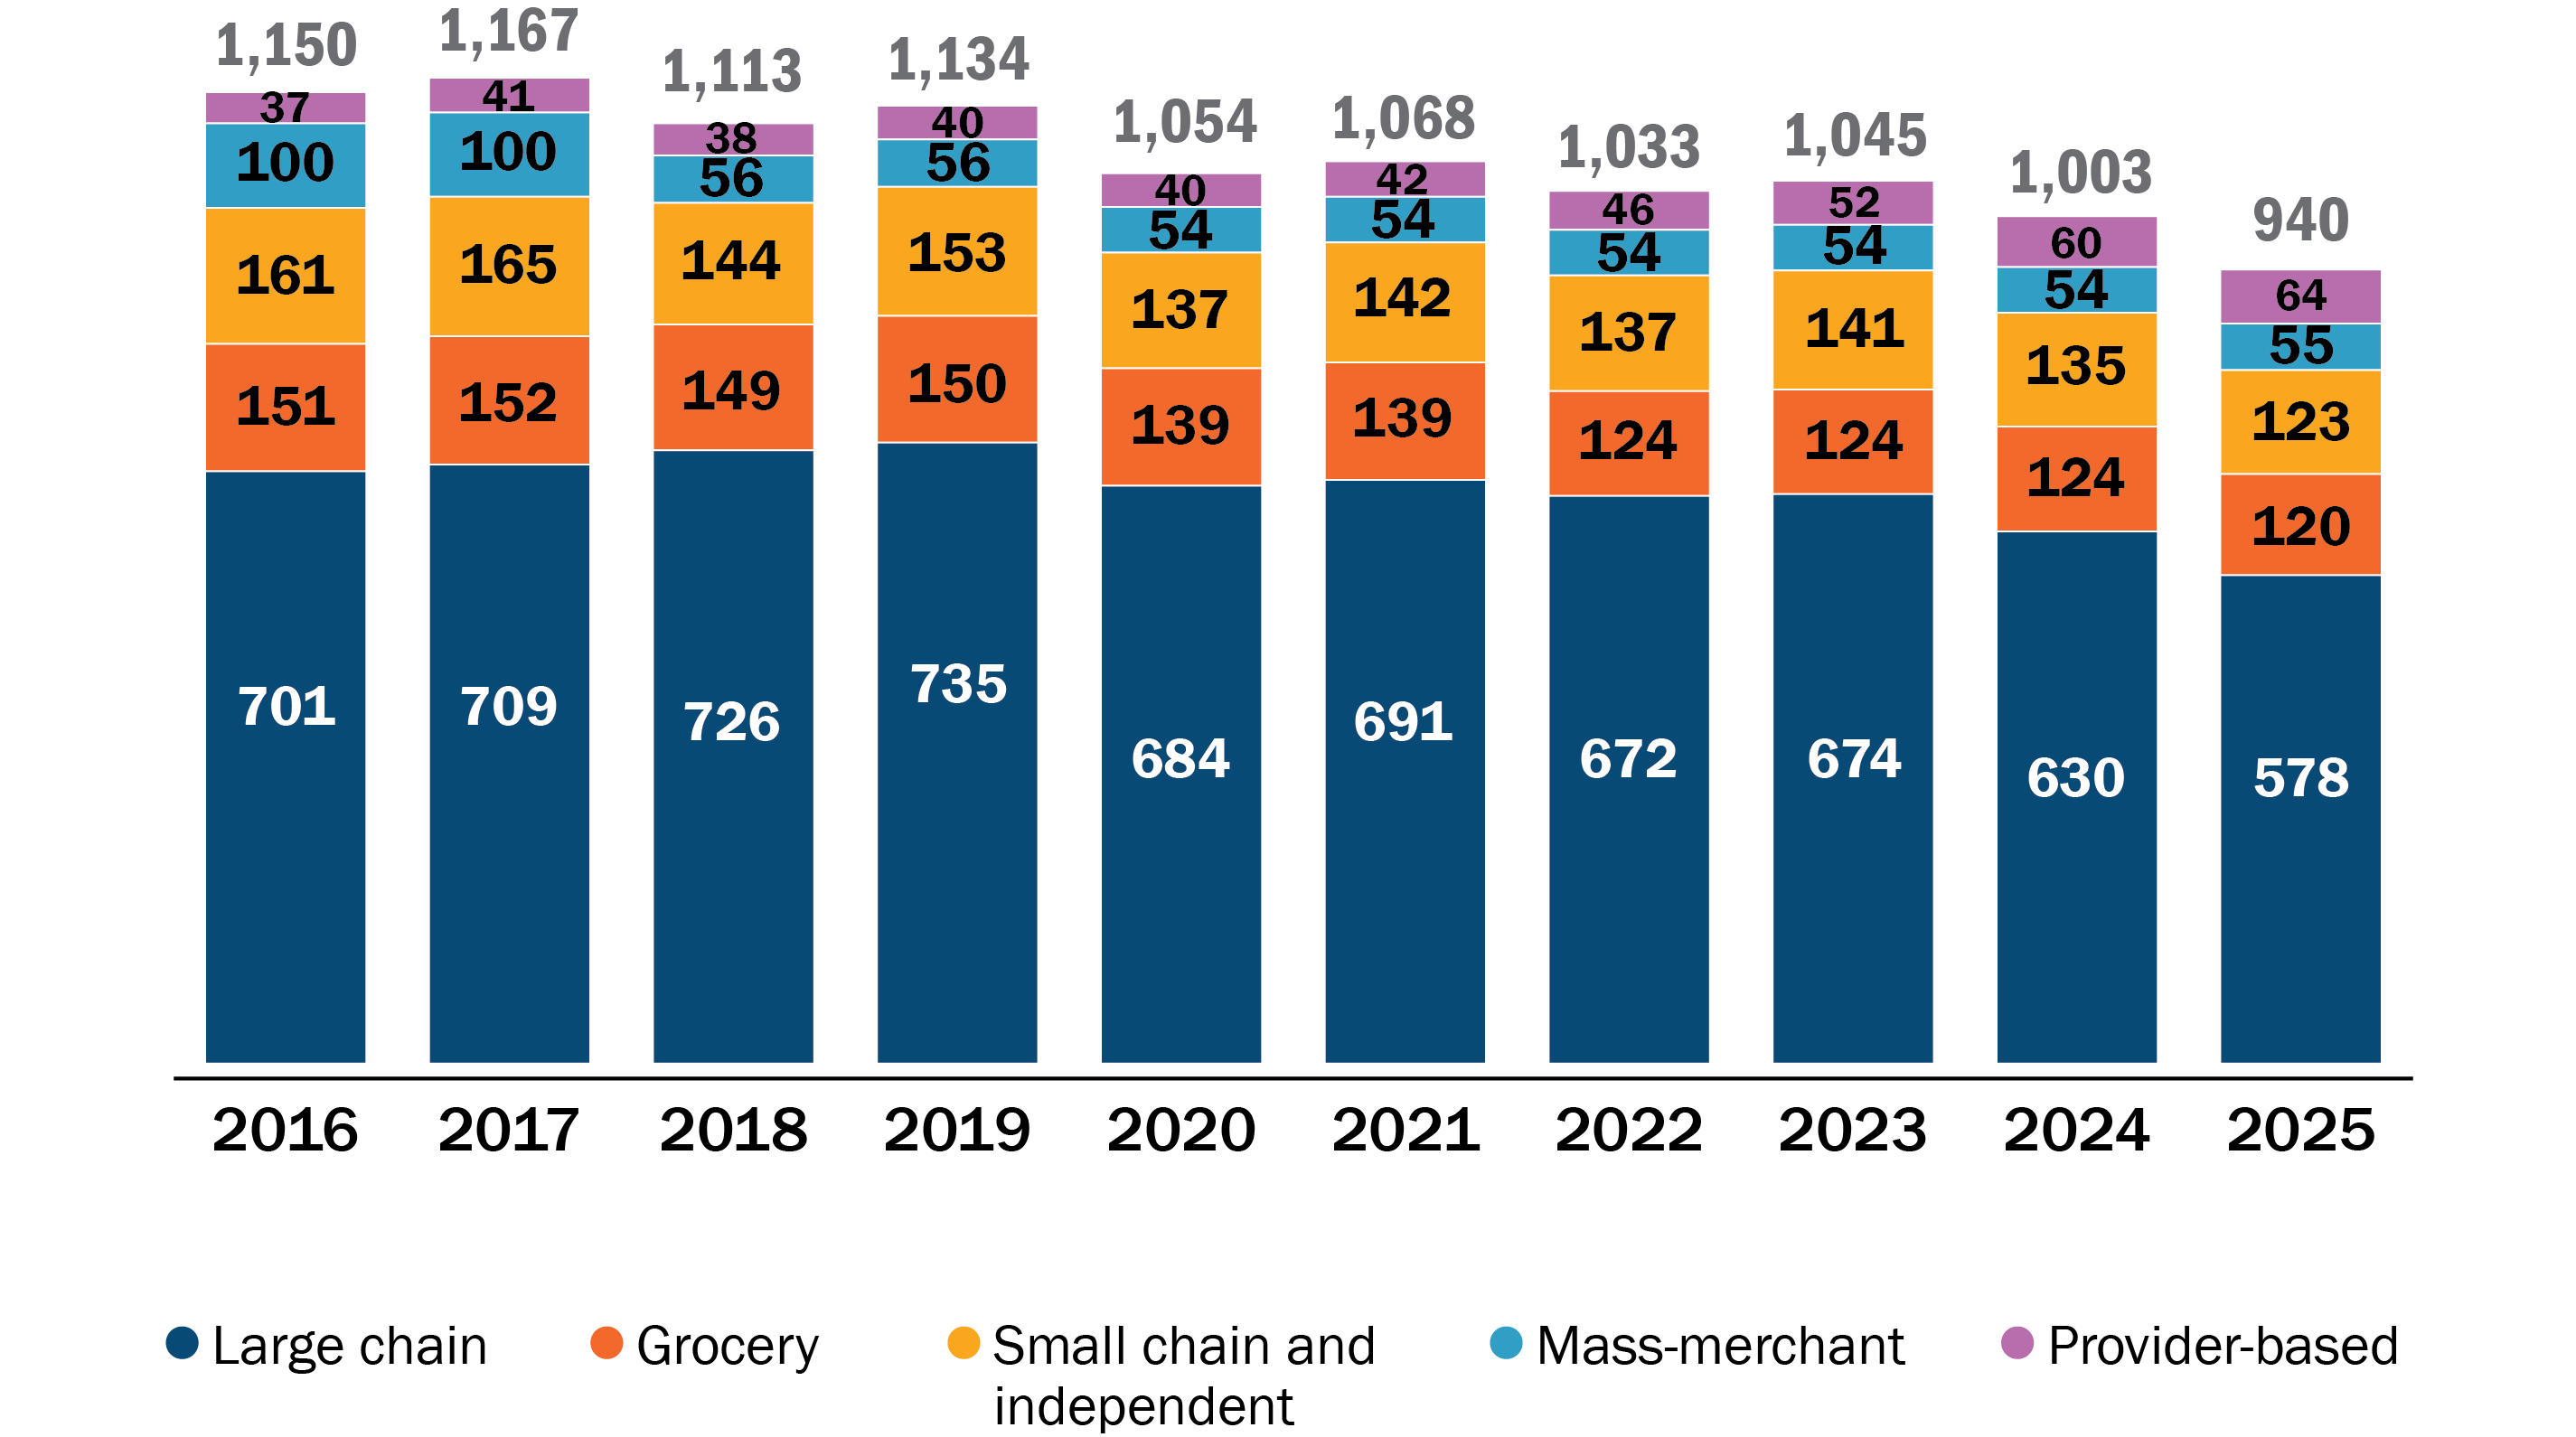
Sources: EOHHS Massachusetts Health Professions License Verification site. Latest update: June 16, 2025.
Figure 1 shows the number of pharmacies by type from 2016 to 2025. From 2016 to 2019, the number of pharmacies declined slightly (by 1.4%) with some pharmacies changing ownership from a mass-merchant to a large chain. Since 2019, however, there has been a 17.1% decline in the number of pharmacies (from 1,134 to 940), with the largest relative decrease for grocery-based, small chains, and independent pharmacies.
Between 2016 to 2025, large pharmacy chains have lost the greatest number of pharmacies but remained at about 60% of all active retail pharmacies; mass-merchants lost the greatest proportion (a 45% decline), small chains/independents and grocery-based lost about 20% each, and provider-based pharmacies had the greatest growth (a 73% increase).
Figure 2: Number of Pharmacy Openings and Closures, 2018-2025
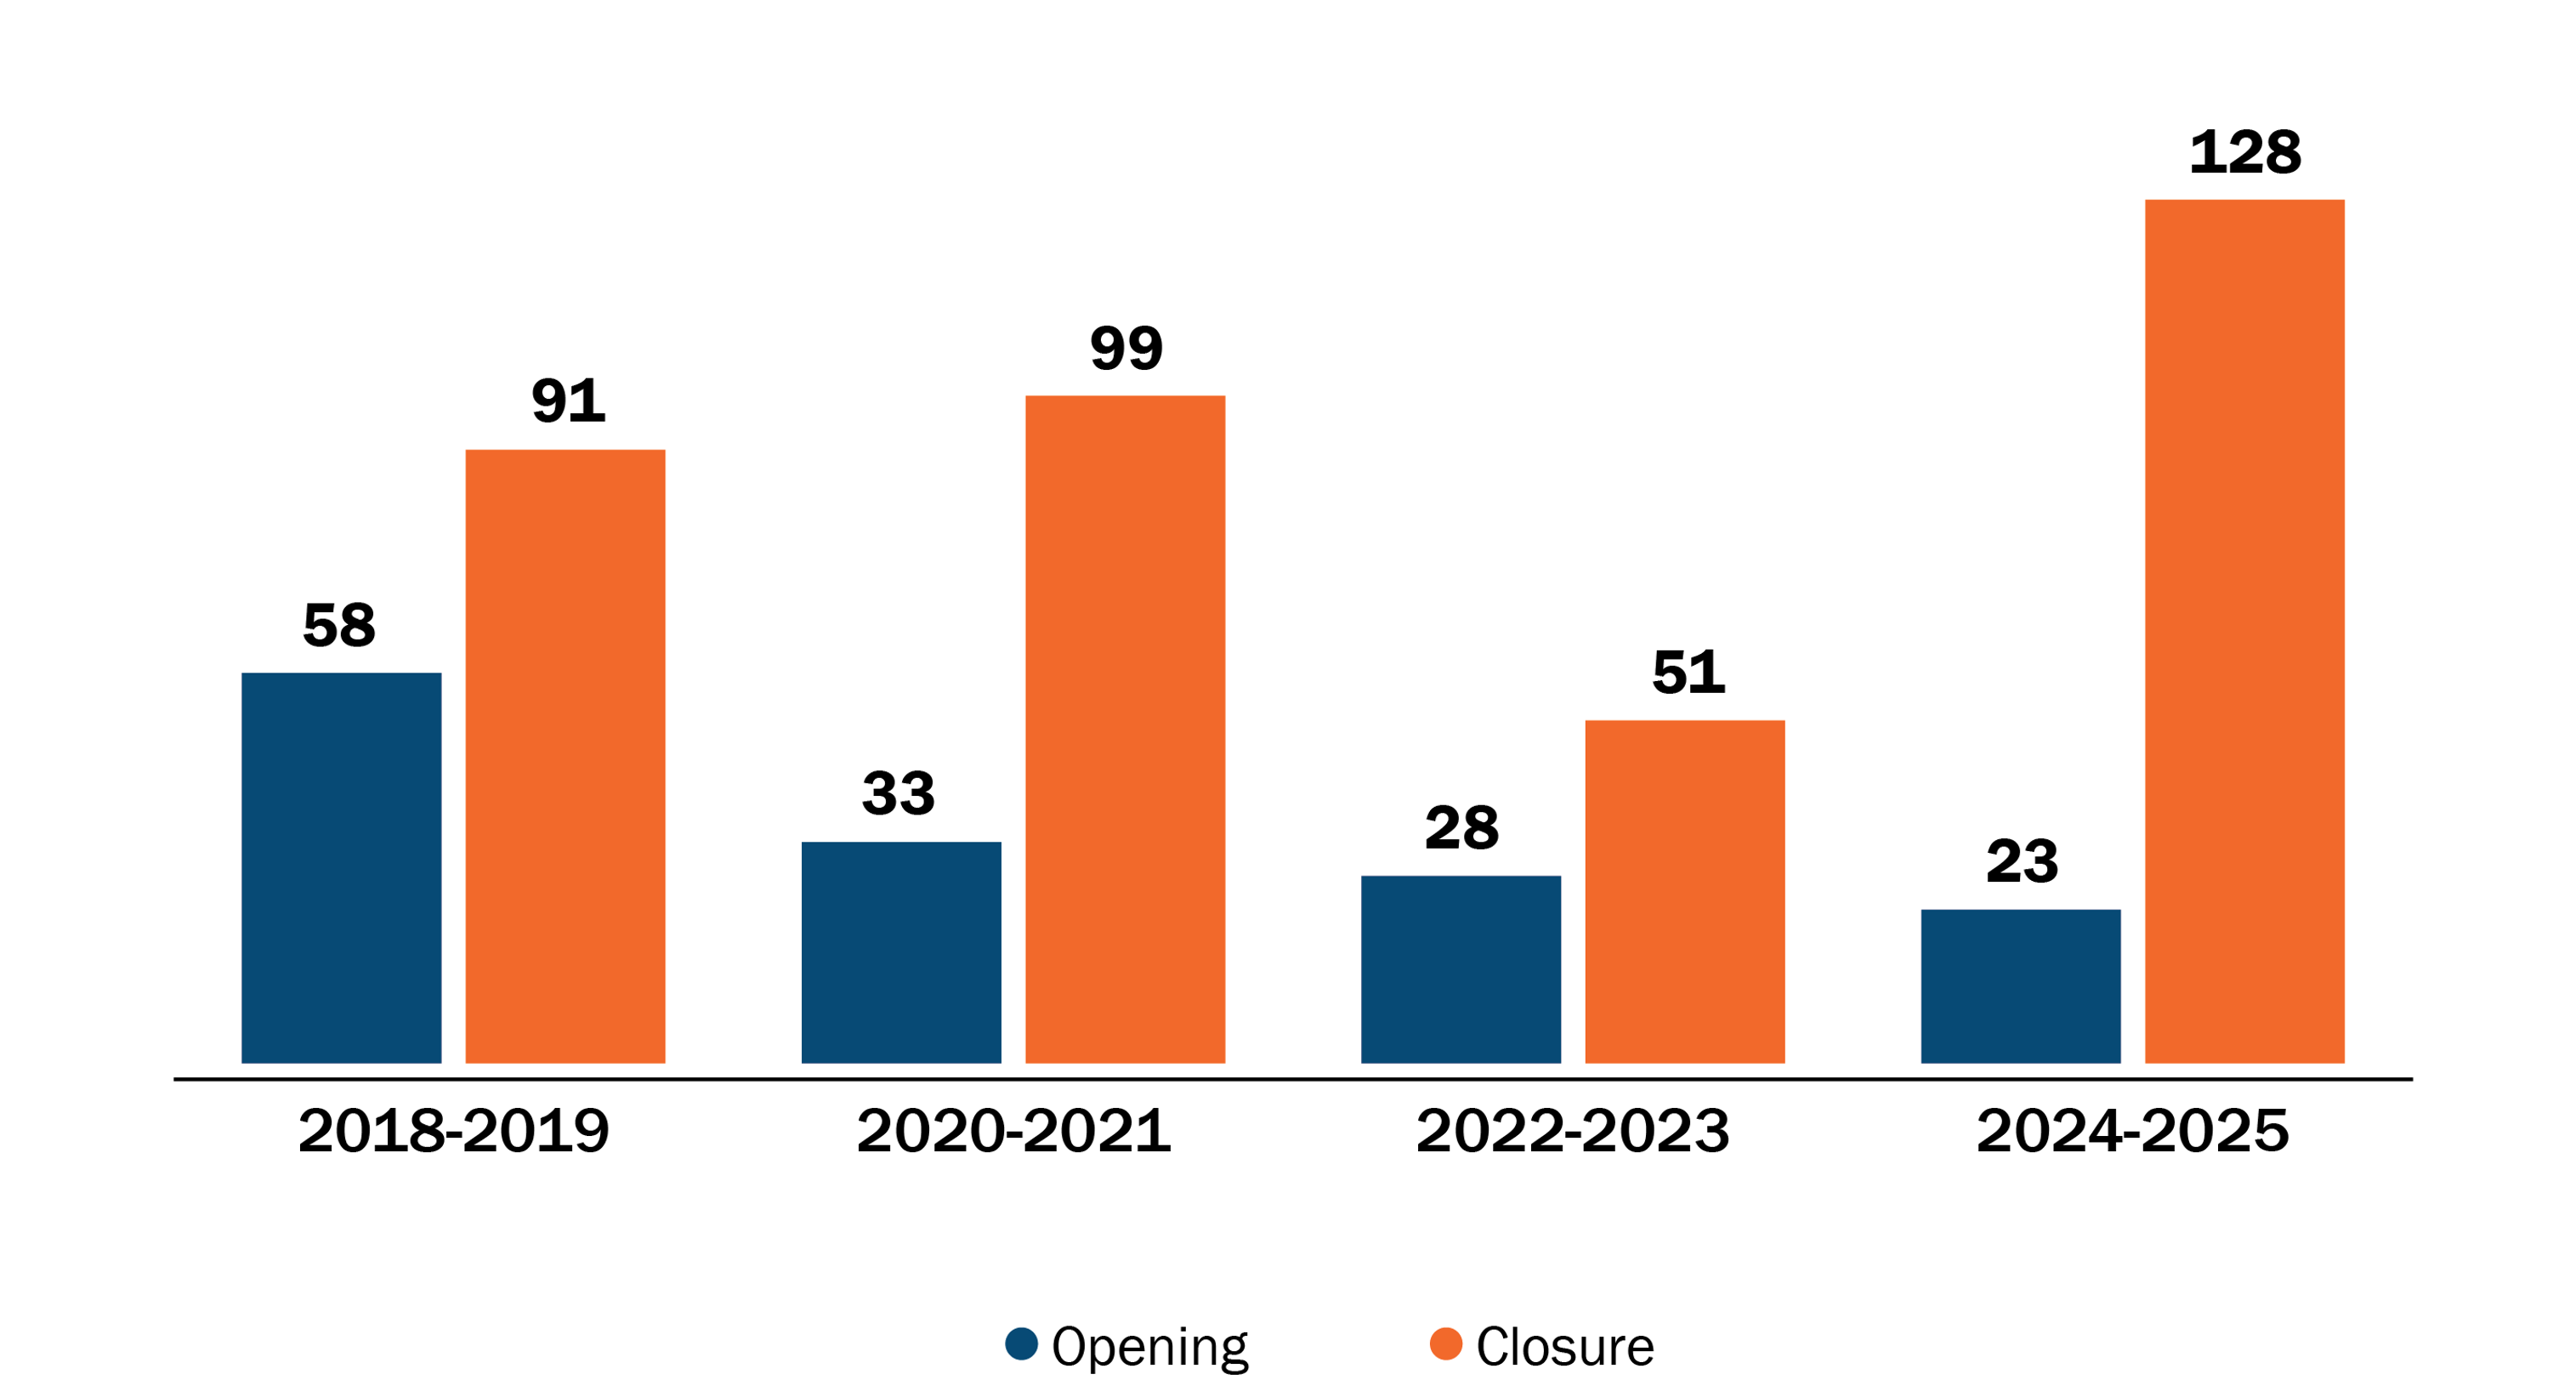
Notes: A closure is generally observed when the license reaches the expiration date with no subsequent renewal. Pharmacy licenses expire every other year on December 31st. As a result, openings and closings are reported in two-year groups.
Sources: EOHHS Massachusetts Health Professions License Verification site. Latest update: June 16, 2025.
Figure 2 shows the number of pharmacy openings and closures from 2018 to 2025. In the licensure data, a closure is generally observed when the license reaches the expiration date with no subsequent renewal.[ii] Pharmacy licenses expire every other year on December 31st. As a result, openings and closings are reported in two-year groups.
Nearly 370 pharmacies have closed in Massachusetts since 2018, while another 140 have opened. Notably, 2024-2025 saw the smallest number of openings and largest number of closures during the study period. Throughout the 2018-2024 period, most closures were in suburban areas but in 2024 and 2025 that shifted, with most closures occurring in urban areas (41%), particularly those with low income or low vehicle ownership. See the interactive visualization below for recent trends in pharmacy openings and closures.
Interactive 2: Tableau Dashboard—Pharmacy Openings and Closures, 2018-2025
Pharmacy Deserts
How a pharmacy desert is defined varies in different analyses.[11],[13],[14],[15],[16],[17],[18] Deserts may be defined based solely on an area’s proximity to a pharmacy (e.g., 0.5 miles, 1 mile, 5 miles, etc.) or additionally account for factors such as prevalence of car ownership and community income.
For this analysis, the HPC used the following approach:
- assess pharmacy access at a granular level (census block groups)
- incorporate varying distance criteria based on population density (rural: 5 miles; suburban 2 miles; urban: 1 mile); and,
- incorporate socio-demographic factors associated with pharmacy access (share of households with a vehicle, share of households below the federal poverty level).
The HPC assessed pharmacy access at the census block group level. Census block groups represent a combination of census blocks, the smallest geographic unit defined by the U.S. Census Bureau, and generally contain between 600 and 3,000 people. Criteria for proximity to a pharmacy varied based on population density, with rural[19] block groups evaluated at 5 miles from a pharmacy, suburban block groups at 2 miles, and urban block groups at 1 mile.[iii] The distance criteria were halved for low-access areas, defined as block groups with below average vehicle ownership or a higher proportion of households below the federal poverty level (more than 20% of households below the FPL). For example, for a suburban block group with below average car ownership, pharmacy access was defined as having a pharmacy within 1 mile.
The HPC defined pharmacy desert status based on how much of the block group was within a given distance from a pharmacy. Block groups with less than 15% of their area within the specified proximity to a pharmacy were considered pharmacy deserts. For example, an urban block group would be considered a pharmacy desert if only 5% of its area had a pharmacy within 1 mile.
Figure 3: Pharmacy Deserts in Massachusetts, 2025
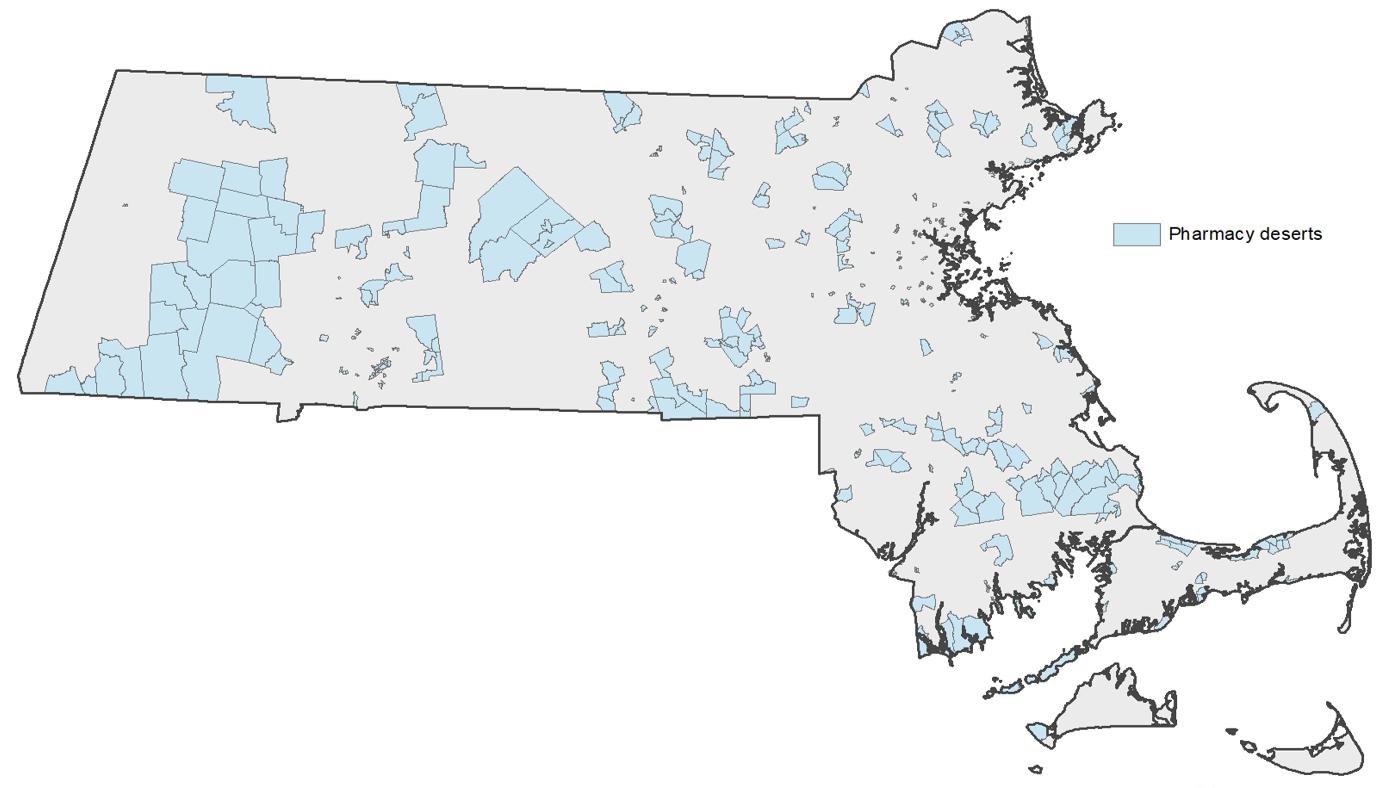
Notes: All mapping and geocoding conducted in ArcMap 10.8/ArcGIS Pro. Conducted using the NAD1983 geographic coordinate system. Population data is based on 2020 Census block groups.
Sources: EOHHS Massachusetts Health Professions License Verification site. Latest update: June 16, 2025. State Office of Rural Health (2023). “Rural Definition.” American Community Survey (ACS), 2023 5-year estimates.
The HPC identified 432 of 5,109 census block groups in Massachusetts as meeting the HPC’s definition of a pharmacy desert in 2025 (Figure 3). Translating block groups to people, the HPC’s analysis estimated that 8.3% of the population in Massachusetts, about 580,000 people, lived in a pharmacy desert in 2025.
The largest proportion of pharmacy deserts were in urban areas of the state (47%), followed closely by suburban areas (43%). Since 2019, 25 previous pharmacy deserts were eliminated and 84 new deserts were created, leading to about 90,000 additional people living in a desert.
Many of the newly created pharmacy deserts were in some of the state’s largest cities, such as Springfield (6), Boston (5), New Bedford (5), and Worcester (6). The top municipalities that eliminated a pharmacy desert during this time were Boston (2), Lynn (2), Malden (2), Northampton (2), Revere (2), and Worcester (2).
Figure 4: Pharmacy Desert and “Near-Desert” Neighborhoods, 2025
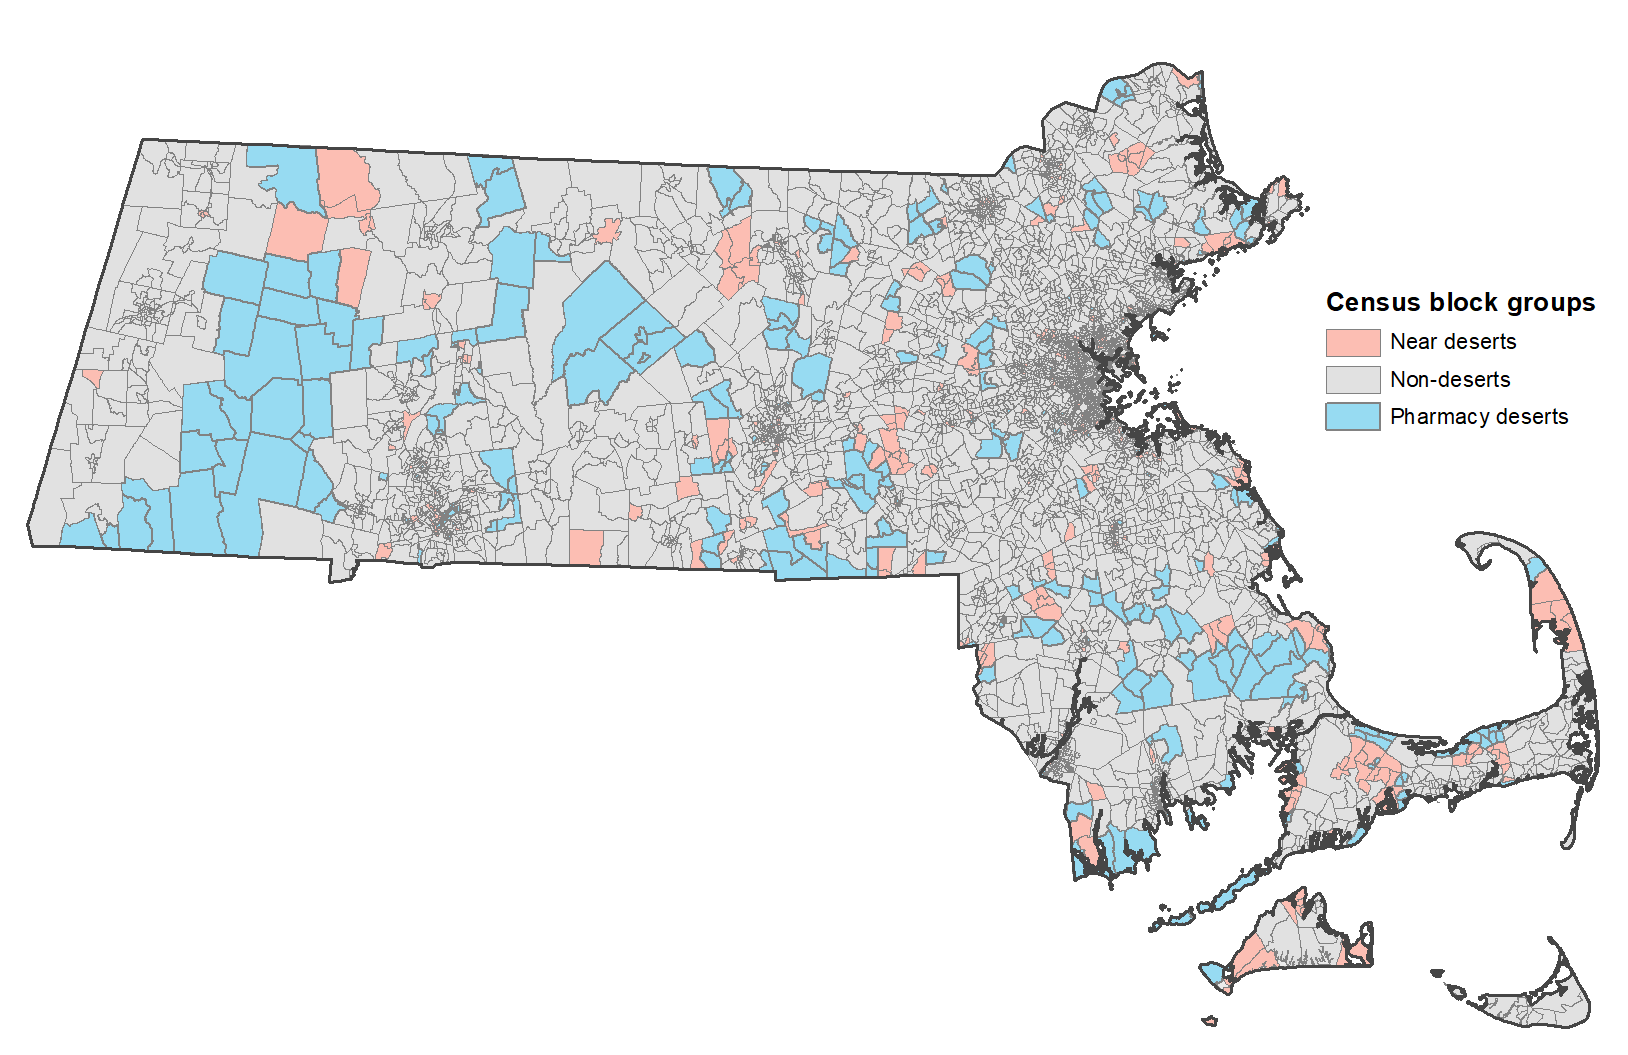
Notes: All mapping and geocoding conducted in ArcMap 10.8/ArcGIS Pro. Conducted using the NAD1983 geographic coordinate system. Population data is based on 2020 Census block groups.
Sources: EOHHS Massachusetts Health Professions License Verification site. Latest update: June 16, 2025. State Office of Rural Health (2023). “Rural Definition.” American Community Survey (ACS), 2023 5-year estimates.
The HPC also assessed “near-deserts,” that is, block groups vulnerable to becoming a pharmacy desert. The HPC defined a “near-desert” as a block group with access to only one pharmacy, such that the area would be a pharmacy desert if the sole pharmacy closed.
In 2025, 416 of 5,109 census block groups met the definition of “near-desert,” which constituted 7.5% of the population, or about 525,000 people. Combined, this puts more than 15% of the population in either a pharmacy desert or at risk of being in one. See the interactive visualization at the end of the section for more information on pharmacy deserts and “near-deserts”.
Table 1: Characteristics of the Population Living in a Pharmacy Desert
| Category | No. of block groups | Population | Area in sq. miles | Pop per sq. mile | Share of households without a vehicle | Share of households below the FPL | Share non-white | Share of population above 65 | Median income | |
|---|---|---|---|---|---|---|---|---|---|---|
| Rural | Non-desert | 398 (85.2% of rural total) | 523,870 | 7.41 | 784.6 | 5.0% | 4.7% | 11.3% | 22.3% | $109,241 |
| Near desert | 26 (5.6% of rural total) | 25,166 | 8.47 | 834.0 | 8.3% | 5.4% | 10.8% | 28.3% | $82,685 | |
| Pharmacy desert | 43 (9.2% of rural total) | 46,399 | 25.48 | 119.8 | 3.5% | 4.6% | 7.5% | 24.5% | $101,789 | |
| Suburban | Non-desert | 2,113 (85.8% of suburban total) | 3,125,274 | 1.72 | 1,989.6 | 5.7% | 4.6% | 20.9% | 19.9% | $129,115 |
| Near desert | 162 (6.6% of suburban total) | 230,350 | 2.29 | 1,222.7 | 4.5% | 3.8% | 15.2% | 20.0% | $132,250 | |
| Pharmacy desert | 187 (7.6% of suburban total) | 288,798 | 4.48 | 794.7 | 3.6% | 3.1% | 12.8% | 21.6% | $142,098 | |
| Urban | Non-desert | 1,750 (80.3% of urban total) | 2,272,099 | 0.13 | 19,533.5 | 21.2% | 10.8% | 44.7% | 13.8% | $100,635 |
| Near desert | 228 (10.5 of urban total) | 270,444 | 0.12 | 15,599.7 | 18.9% | 11.7% | 48.8% | 14.7% | $89,912 | |
| Pharmacy desert | 202 (9.3% of urban total) | 247,517 | 0.14 | 12,876.5 | 19.1% | 12.3% | 43.6% | 13.8% | $85,089 |
Table 1 shows characteristics for populations in each block group category in 2025. In urban areas, deserts were in neighborhoods with lower median income ($85,000 vs. $101,000) and a higher share of families in poverty. However, these patterns were not present in other areas.
Overall, pharmacy deserts tended to be in neighborhoods with lower population density and a somewhat higher proportion of residents over the age of 65 years old. Urban and rural areas had slightly larger shares of block groups that were pharmacy deserts: 9% of urban and of rural block groups were deserts, compared to 8% of suburban block groups. In urban areas, 20% of block groups were in deserts or “near-deserts,” compared to 15% of rural block groups and 14% of suburban areas.
Interactive 3: Tableau dashboard—Pharmacy Deserts and “Near-Deserts” in Massachusetts, 2025
Conclusion
Pharmacies provide an important health care access point. Pharmacy closures, and the deserts that can result, can threaten access and exacerbate existing disparities. While all types of pharmacies provide critical access across Massachusetts and face pressures, small chain and independent pharmacies face particular financial challenges.
Currently, 8.3% of the Massachusetts population, about 580,000 people, lives in a pharmacy desert. This represents an increase of approximately 90,000 people living in a pharmacy desert since 2019, which is a direct consequence of the closure of nearly 200 pharmacies (on net) between 2019 and 2025. Another 7.5% of the population, about 525,000 people, lives in an area that would be a desert if the sole pharmacy in the area closed.
Timely policy action is needed to increase and sustain equitable pharmacy access in the Commonwealth. Chapters 342 and 343 of the Acts of 2024 charged the Health Policy Commission with establishing two new offices: the Office of Pharmaceutical Policy and Analysis (OPPA) and the Office of Health Resource Planning (OHRP). The main function of OPPA is to serve as the hub of expertise on pharmaceutical drug policy in Massachusetts by collecting and analyzing pharmaceutical data, conducting cutting-edge analyses related to access, affordability, and spending on pharmaceutical drugs in the Commonwealth, and developing recommendations on pivotal matters related to pharmaceutical policy. OHRP is to charged with evaluating the supply and distribution of health care resources across the Commonwealth. OHRP leads the Commonwealth's first comprehensive state health planning initiative in over a decade. The HPC plans to leverage these two new offices to continue examining trends in pharmacy deserts in the coming months.
Additional Resources
Public Dataset, Pharmacy Deserts 2025 (XLSX)
Census block groups from MassGIS (SHP)
Notes
Percentages may not total 100% due to rounding.
[i] A closure is only observed when the license reaches the expiration date with no subsequent renewal. Pharmacy licenses expire every other year on December 31st. As a result, openings and closings are reported in two-year groups.
[ii] A closure is only observed when the license reaches the expiration date with no subsequent renewal. Pharmacy licenses expire every other year on December 31st. As a result, openings and closings are reported in two-year groups.
[iii] The HPC defined suburban as non-rural neighborhoods with a population density below 5,000 per square mile and urban areas as those with a population density above 5,000 per square mile. Suburban and urban areas were evaluated at the census block group level.
Suggested citation: Massachusetts Health Policy Commission. DataPoints Issue 31: When the Closest Pharmacy is Too Far: Mapping Pharmacy Deserts in Massachusetts. October 23, 2025. Available at: https://masshpc.gov/ publications/datapoints-series/issue-31-when-closestpharmacy-too-far-mappingpharmacy-deserts
Sources
[1] Qato et al. (2019). “Association Between Pharmacy Closures and Adherence to Cardiovascular Medications Among Older US Adults.” JAMA Network Open (April 19, 2019).
[2] CVS. “Our history.” Accessed February 21, 2025.
[3] McKinsey and Company (2023). “Meeting changing consumer needs: The US retail pharmacy of the future.”
[4] Guadamuz (2019). “Assessment of Pharmacy Closures in the United States From 2009 Through 2015.” JAMA (October 21, 2019).
[5] Massachusetts Independent Pharmacists Association (2021). “Pharmacy Reimbursement Trends in Massachusetts."
[6] Meyersohn (2024). “Why Walgreens, CVS and Rite Aid are closing thousands of drug stores across America.” CNN (June 28, 2024).
[7] Selyukh (2024). “CVS and Walgreens are ailing. Here's why.” CNN (October 16, 2024).
[8] Gregg et al. (2023). “Drugstore closures are leaving millions without easy access to a pharmacy.” Washington Post (October 22, 2023).
[9] Catalano et al. (2024). “Pharmacy Accessibility and Social Vulnerability.” JAMA Network Open (August 23, 2024).
[10] NBC10 Boston (2022). “3 Walgreens in Boston Set to Close, Creating ‘Pharmacy Deserts' for Some” (November 7, 2022).
[11] Kohli et al. (2024). “Walgreens, CVS closures in Boston contribute to 'pharmacy deserts.'” The Boston Globe (July 25, 2024).
[12] Massachusetts Office of Health and Human Services (EOHHS) Health Professions License Verification Site. Last accessed: 6/16/2025
[13] Qato et al. (2014). “'Pharmacy deserts' are prevalent in Chicago's predominantly minority communities, raising medication access concerns.” Health Affairs (November 2014).
[14] Wisseh et al. (2020). “Social Determinants of Pharmacy Deserts in Los Angeles County.” Journal of Racial Ethnic Health Disparities (December 2021).
[15] Guadamuz et al. (2021). Fewer Pharmacies In Black And Hispanic/Latino Neighborhoods Compared With White Or Diverse Neighborhoods, 2007–15.
[16] Ying et al. (2022). “Pharmacy deserts: More than where pharmacies are.” Journal of the American Pharmacists Association (November 2022).
[17] Urick et al. (2023). “State Telepharmacy Policies and Pharmacy Deserts.” JAMA Network Open (August 14, 2023).
[18] Witenauer et al. (2024). “Locations and characteristics of pharmacy deserts in the United States: a geospatial study.” Health Affairs Scholar (April 2024).
[19] Rural neighborhoods were defined according to the Massachusetts Department of Public Health - State Office of Rural Health definition of rural.